
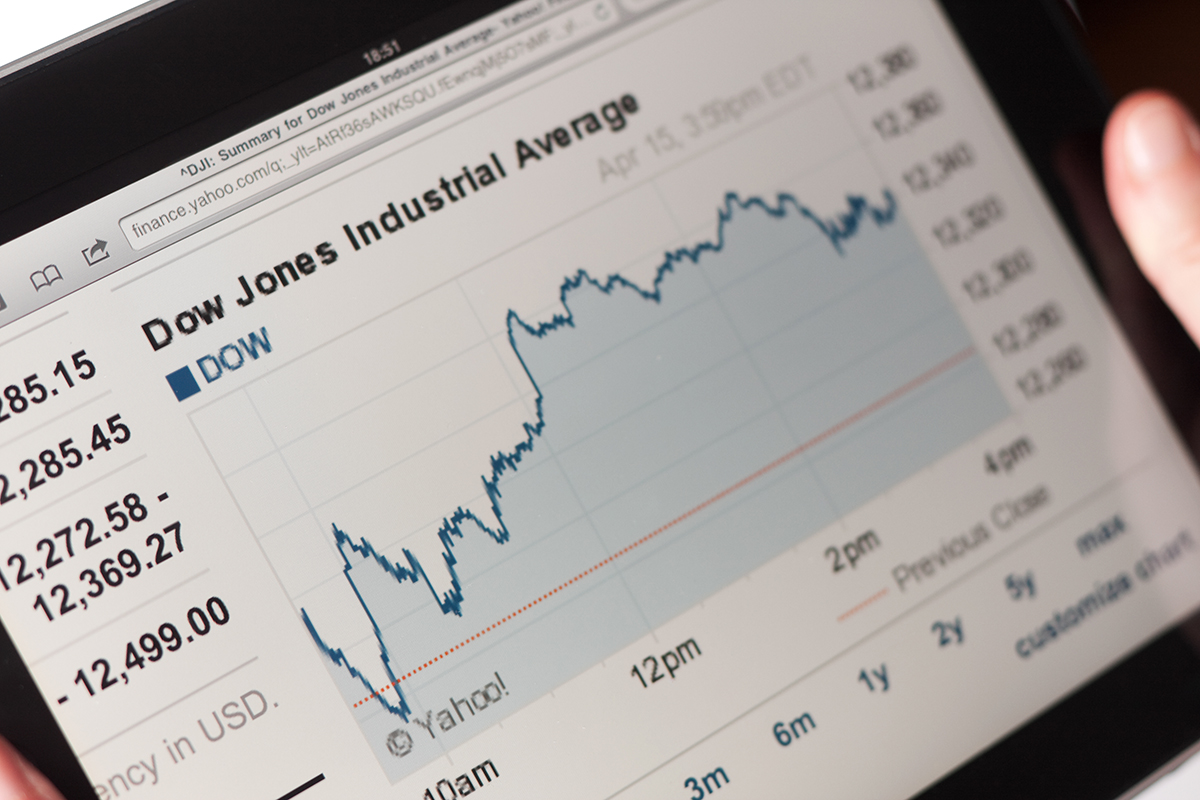
The S&P 500 posted its best week since November, gaining 3.6% as markets decided that geopolitical de-escalation was the only variable that mattered. The Nasdaq added 4.7%. The Dow gained 3%. Every leg of the move was built on the assumption that the two-week U.S.-Iran ceasefire holds past this weekend's talks in Islamabad. Five charts tell the story.
Chart 1: S&P 500 — Two-Week Recovery Off the Iran Lows
The S&P 500 rallied for seven consecutive sessions before snapping the streak Friday with a 0.11% pullback. The total weekly gain of 3.6% is the largest since November and leaves the index 2.32% off its January 27 all-time high. The Nasdaq did even better at +4.7%, also its best week since November. Every leg of the move was tied to incremental progress on the U.S.-Iran ceasefire and the prospect of weekend talks in Islamabad. The CPI print did not derail it. Hot economic data did not derail it. The market decided this week that geopolitical de-escalation was the only thing that mattered.
S&P closed Friday at 6,816.89. Nasdaq at 22,902.89. Dow at 47,916.57.
Chart 2: U.S. CPI — Month-over-Month Change
March CPI jumped 0.9% month-over-month, the largest single-month print since June 2022, when prices spiked in response to the Russia-Ukraine invasion. Year-over-year headline CPI moved to 3.3%, up sharply from 2.4% in February. Almost all of the increase came from the energy component, reflecting the oil shock that followed the late-March escalation in the Middle East. Vail Hartman at BMO Capital Markets noted that core and supercore inflation remained tame, giving the Fed some cover to look through the print, but warned that a persistent energy shock would eventually filter into core categories.
If the Islamabad talks fail and oil retests recent highs, the next CPI print will not be looked through. The Fed's rate path becomes the second-order risk to a ceasefire breakdown.
Chart 3: YTD Performance — Mag 7 vs. Software Sector
Five Mag 7 names, AVGO, META, GOOGL, AMZN, and NVDA, accounted for roughly 45% of the S&P 500's move during the seven-day winning streak. NVDA logged its eighth straight day of gains by Friday. The Philadelphia Semiconductor Index hit an all-time high. Lumentum's CEO told Bloomberg the company is sold out through 2027 on AI optical demand. But underneath the index-level rally, the iShares Expanded Tech-Software ETF closed at levels not seen since November 2023. Names like ServiceNow, Workday, Snowflake, and Monday.com are down more than 40% YTD as the market prices in AI displacement of seat-based SaaS revenue.
"Tech is up" is no longer a useful sentence. Concentration risk inside the S&P 500 has rarely been higher, and the divergence inside tech itself means a single AI capex disappointment could hit the entire index disproportionately.
Chart 4: Brent Crude — From the Spike to the Truce
Brent peaked above $112 in late March on the worst-case Hormuz scenario and has worked steadily lower since the two-week ceasefire was announced. WTI closed Friday at $95.63, down 2.29% on the day, even as President Trump warned via Truth Social that U.S. warships were being reloaded for further strikes if peace talks failed. The disconnect between the President's escalation language and the price action tells you exactly where the oil market is positioned: long de-escalation, short tail risk, and pricing in a successful Islamabad outcome that has not yet been agreed.
Canadian energy producers were the single biggest beneficiary of the March spike. Most of that benefit unwinds if Brent settles below $90. The asymmetry from here is to the downside on a clean ceasefire and to the upside only on a clear collapse of talks.
Chart 5: TSX Sector Performance — Week of April 6
The TSX closed Friday at 33,695.76, up 0.65% on the day, with the Capped Energy Index up 1.49% and the Capped Financials Index up 0.56%. For the week, energy was the clear leader, followed by materials and financials. The Canadian dollar held at 0.7225 against the USD. The Canadian story this week was almost entirely an energy story: a TSX whose largest sector weight is petroleum, in a week where crude held above $95 despite a clear ceasefire trajectory.
Canadian investors with overweight energy positions had a great week and a fragile setup for next week. The one-trade portfolio Canada always carries, long oil, long banks, long the loonie, is intact, but every leg of it is downstream of the same single weekend headline.
What to Watch Monday
Islamabad talks outcome: Vance and Witkoff are negotiating directly with Iranian counterparts this weekend. A formal ceasefire extension or framework agreement would justify the rally; a breakdown reverses it.
Bank earnings kickoff: Goldman Sachs reports Monday before the open, with JPMorgan, Citi, Wells Fargo, and BlackRock following Tuesday. Watch loan loss provisions and net interest margin guidance for the BoC and Fed read-across.
Brent crude open: Sunday evening futures will price the weekend's diplomatic outcome before equity markets get a chance to react Monday morning.
Software ETF technicals: The IGV is testing November 2023 levels. A break below confirms the AI displacement thesis is now a structural sector call, not a sentiment trade.
The Close
Quote that aged badly: "The energy shock from this conflict is likely to keep oil above $100 well into the second half, with $120 a realistic base case if Hormuz transit remains contested." Major sell-side commodity strategist note, late March 2026. A two-week ceasefire was announced within ten days. WTI closed this Friday at $95.63, down from a late-March peak above $112. Markets had their best week since November on the same de-escalation the note said was unlikely.