
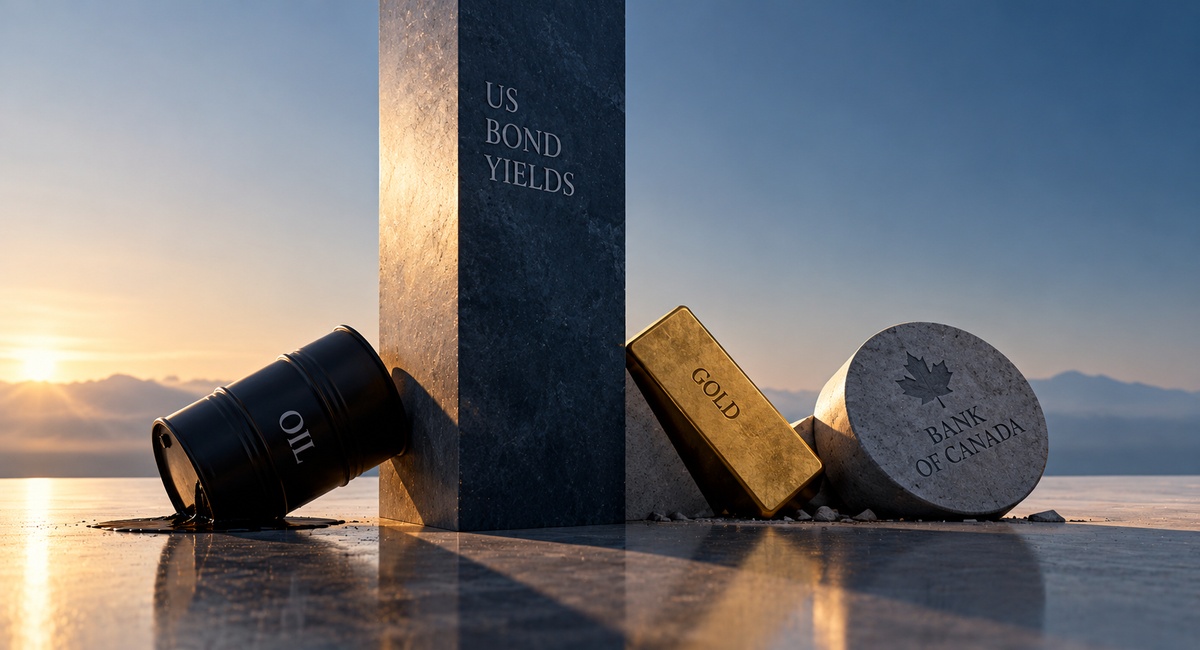
September began with a war and ended with a bond market. Brent crude rose 14% in the month, the Federal Reserve raised its policy rate for the first time since 2023, the Bank of Canada held for a seventh consecutive meeting, and the Strait of Hormuz stayed closed to normal traffic for a seventh month. The TSX still fell 2.6%, the Canadian dollar fell 2.3% and gold fell 5.5%. All three moves line up against the same variable, and it is not oil. It is the US 10-year Treasury yield, which crossed 5% for the first time since 2007 and closed the month at 5.29%.
Section 01The Month at a Glance
Eight numbers, and the two with the least apparent connection are the ones that explain the rest. The Bank of Canada did not move its rate at all, yet its 2-year and 5-year yields rose 36 basis points each. Oil rose by an amount that would normally lift a Canadian equity index and a Canadian dollar, and both fell. The variable that changed the most was neither a central bank decision nor a barrel of crude. It was the price of long-dated US government debt, and by the final session of the month it had carried the 10-year Treasury yield to 5.29% and the 30-year to 5.64%.
Section 02The Arc of the Month
The month opened under the weight of the last week of August. US strikes on Larak Island on August 30 and Iranian retaliation had taken the TSX to 36,180.72 on August 31, already 2.1% below the August 25 record close of 36,957.63. The index fell another 1.0% on September 1, to 35,825.73, as tanker attacks in the Strait of Hormuz returned the war premium to oil.
The first week then turned on the Bank of Canada and a jobs report. The Bank held at 2.25% on September 2 and its governor said it stood ready to raise more than once if energy inflation persisted. The TSX rose 0.74% that day and 1.50% on September 3, to 36,633.12, the highest close of the month and 0.9% below the record. On September 4 Statistics Canada reported a loss of 41,700 jobs in August against a consensus gain of about 15,000, with average wage growth slowing to 2.0%, the slowest pace in nine years. US payrolls the same day added 162,000 against an expected 53,000.
The second week was the tanker war. Canada's retaliatory tariffs on $27.6 billion of US goods took effect on September 8, the Saudi-flagged tanker Sidr had been struck with the loss of two crew, and Houthi forces hit three Saudi Aramco sites. On September 10 the Saudi East-West pipeline, the main bypass around Hormuz, was struck and shut. WTI closed at US$102.48 that day and Brent at US$107.63. The TSX lost 1.11% on the same session, to 35,506.30. Brent peaked at US$108.75 on September 15.
The third week belonged to the Federal Reserve. On September 16 it raised its target range 25 basis points to 3.75 to 4.00%, by unanimous vote, with 16 of 18 officials projecting at least one more hike before year end. The TSX closed that day at 35,491.30, the low of the month to that point. It rebounded 1.08% the next day as Treasury yields retreated, reached 36,335.61 on September 22 on reports that President Trump was open to meeting Iranian President Pezeshkian at the UN General Assembly, and then lost 584.18 points on September 23, its worst session in more than three months, as copper, gold and silver reversed and the US 10-year yield rose 15 basis points to 5.11%.
The last week was a bond market story. Iran offered to reopen the Strait within seven days, conditional on eased US military pressure. On September 28 Washington rejected the plan and demanded that nuclear terms come first. Gold futures fell 3.5% in that single session, to US$4,168.40, and the TSX fell 0.87%. The 10-year Treasury yield passed 5.2%. On September 30 core PCE inflation came in at 3.0% against 3.3% expected, and the odds of an October Fed hike fell from about 71% on September 29 to about 37% by the morning of September 30, on two different trackers. The front end of the Treasury curve priced the soft print. The 30-year yield did not: it rose to 5.64%. The TSX closed the month at 35,235.90.
The TSX closed September 2.6% lower, and the path was a decline through the tanker war, a partial recovery after the Fed decision and a second slide through the bond market selloff of the final week.
The TSX through September. The shaded span marks the September 8 to 16 slide through the tanker war and the Federal Reserve decision; the dashed line is the August 25 record close. September 7 was Labour Day and the market was closed.
The remainder of this report isolates the five patterns inside that arc. Each became visible only across the full twenty-one sessions, and each carries a specific implication for the October 2 payrolls report, the October 19 CPI release and the October 28 decisions of both central banks.
Pattern OneCanadian Borrowing Costs Followed the US Long End, Not the Bank of Canada
The Bank of Canada policy rate did not change in September. The Government of Canada 2-year yield rose from 3.01% to 3.37%, the 5-year from 3.33% to 3.69% and the 10-year from 3.73% to 3.99%, and USD/CAD rose on fifteen consecutive daily observations, from 1.3784 on September 8 to 1.4188 on September 29. The currency and the yield curve repriced without the central bank doing anything.
The timing of the large moves points to the US long end, not to either central bank. On September 16 the Federal Reserve raised its rate, and the Canadian 10-year yield fell 3 basis points that day and another 9 the next, to 3.83%, as US Treasury yields retreated from their post-decision spike. On September 23, with no central bank event, the US 10-year yield rose 15 basis points and the Canadian 10-year rose 13, to 3.96%. The spread between the two 10-year yields widened from 100 to 128 basis points between August 28 and September 28, and 19 of those 28 basis points arrived after the Fed hike.
Bank of Canada yields did respond to one domestic event. The 2-year yield rose 10 basis points on September 2, the day of the hold, because the Bank said it could hike more than once. The 2-year then rose another 26 basis points through September 14 as oil climbed, and 15 of that came on September 10 alone. The front end of the Canadian curve moved on inflation risk. The long end and the currency moved on Treasuries.
The 2-year, 5-year and 10-year yields rose together through the month, with the largest step on the oil surge of September 10 and a second on the US yield jump of September 23, and with a decline on the day after the Fed hike.
Government of Canada 10-year, 5-year and 2-year benchmark yields. No Bank of Canada benchmark yield was published for September 30, so the series ends September 29. The shaded span marks the September 9 to 10 oil surge.
Why it matters going forward. A fixed mortgage prices off the 5-year yield, and roughly a third of Canadian mortgage holders face renewal by the end of 2026 with average payment increases near 20% at current rates. The 36 basis point rise in the 5-year yield arrived without a Bank of Canada decision, which means the next Canadian rate shock can come from Treasury auctions as easily as from Ottawa. The September 30 session showed the split directly: the 3-month Treasury yield fell 8 basis points to 4.20% on the soft PCE print while the 30-year rose 8 to 5.64%. A hike that becomes less likely at the front end has not made duration cheaper at the back.
Pattern TwoThe TSX Stopped Trading Like an Oil Index
Brent rose 14.4% in September and WTI 5.4%. The TSX, an index weighted heavily to energy, fell 2.6%. The iShares S&P/TSX Capped Energy ETF fell 2.2% through September 29, so even the energy equities did not follow the barrel.
The sector detail through September 29 explains the gap. The iShares S&P/TSX Global Gold ETF fell 7.5% and the Capped Materials ETF fell 6.2%, with most of that on September 28. Utilities lost 3.0% as yields rose. Financials were nearly unchanged at a loss of 0.3%, and technology gained 3.9%. The S&P 500 finished the same period down only 0.2%, so the Canadian shortfall sits in resources and rate-sensitive income stocks, not across the whole market.
Energy equities lagged the oil price in both directions. WTI peaked at US$102.48 on September 10, and the energy ETF had gained only about 2% to that point. It did not peak until September 15, and it fell 1.3% on September 29 when WTI dropped 3.5%. Equity investors treated the oil rally as a risk premium that could unwind, not as a durable earnings change, and the Saudi East-West pipeline restart and a September high in Middle East crude exports gave them reasons to do so.
The tariff fight added a second drag unrelated to oil. The 50% US tariff under Section 338 took effect on August 22, with energy, potash and critical minerals exempt, and Canada retaliated on September 8. A US procurement threat on September 10 hit engineering and IT services names such as CGI, WSP, AtkinsRealis and Stantec by more than 2%, and Bombardier by 7 to 8%.
Brent ended September 14.4% above its August 31 close while the TSX ended 2.6% below it and gold 5.5% below it, a three-way split that no single commodity story explains.
Each series is rebased to 100 at the August 31 close, marked by the dashed line. Brent and gold are front-month futures closes; the TSX is the official index close. September 30 values: Brent 103.53, TSX 35,235.90, gold 4,235.40.
Why it matters going forward. A Canadian portfolio holding the TSX as a proxy for oil exposure received the opposite of the proxy in September. Energy equities are priced on the view that oil above US$90 will not last, and Western Canadian Select near US$82 shows how much of the Brent move never reached the Canadian producer. The index will track oil again only if the market starts to believe the price is durable, and the restart of the Saudi bypass runs against that.
Pattern ThreeGold Stopped Behaving as a Haven
Gold futures closed September at US$4,235, down 5.5% for the month and 8.2% from the September 3 high close of US$4,539.90. The metal fell through the month's worst war headlines, and its largest single-day drop came on a day of escalation, not de-escalation.
The break with the 2026 pattern was visible on August 31, when gold fell about 1% during a live exchange of US and Iranian strikes, the first time in the conflict that gold and oil moved in opposite directions on an escalation. The pattern held through September. On the sessions when the US 10-year yield rose, gold fell an average of about 0.75%. On September 23, with the 10-year up 15 basis points, gold futures fell 1.3%. On September 28, after Washington rejected the Iranian plan, gold futures dropped 3.5% from US$4,321.20 to US$4,168.40 and the gold miners ETF fell 5.2% in the session.
Gold pays no yield, so its price is exposed to real rates. With core PCE at 3.0%, a 10-year Treasury yield of 5.29% offers a real return above two percentage points, and the metal repriced against it. HDQ reads the slide as the market pricing a higher path for real yields, an inference and not a statement from any central bank. The long-run case is intact in some forecasts: Goldman Sachs has kept a year-end target of US$4,900.
Why it matters going forward. Gold producers sit inside the TSX materials weight, so the metal is now a direct drag on the index, not a hedge inside it. A client who held gold as insurance against the war lost on both the war and the yield. The test for October is whether the metal can hold US$4,170 if the 10-year yield stays above 5%, and whether it responds to a genuine escalation, which September suggests it will not do on its own. Realized losses on gold positions in a taxable account are also now available to harvest, subject to the superficial loss rule.
Pattern FourMarkets Priced a Hiking Bank of Canada Into the Weakest Domestic Data of the Year
On September 8, markets priced better than a 92% chance of an eighth straight Bank of Canada hold on October 28. By September 25, overnight swap pricing implied a 59% probability of a hike, and by September 29 roughly 100 basis points of hikes over twelve months. The domestic data arrived in the opposite direction.
The case for a hike is one number. Headline CPI held at 3.0% in August, with gasoline up 22.8% from a year earlier. The case against is nearly everything else. Canada lost 41,700 jobs in August, with full-time employment down 35,900. Average hourly wage growth fell to 2.0%, the slowest since November 2017 outside the pandemic. Real GDP was flat in July, July retail sales fell 0.7%, and the August advance estimate of +0.2% leaves the third quarter tracking about 2% annualized against 3.3% in the second. The Bank itself cut its 2026 growth forecast to 0.7% on September 2. Core inflation measures sit near 2.0%, although CPI excluding gasoline rose to 2.4% from 2.2%.
Bank economists are split from the market. National Bank and Scotiabank forecast a hike to 2.50% in October. Most others expect a freeze through 2026. The Bank of Canada told the market on September 2 that it could raise rates more than once if oil kept inflation up, and the market took the sentence at its widest reading. The policy gap to the Fed, now 175 basis points at the upper bound after the September 16 hike, reinforces the pull: a Canadian rate that stays at 2.25% while the US moves to 4.00% is the setting in which the currency fell 2.3%.
Why it matters going forward. Pricing for a hike this far ahead of weak labour and growth data leaves the Canadian 2-year and 5-year yields exposed in both directions. If the September CPI release on October 19 shows core inflation near 2% and ex-gasoline inflation easing, the priced hikes unwind and short yields fall back toward where the month started. If ex-gasoline inflation keeps firming, the Bank has a reason to move on October 28, with a full Monetary Policy Report to justify it.
Pattern FiveDiplomacy Pushed Oil Down Each Time the Saudi Bypass Pushed It Up
Brent rose 7.4% in two sessions after Iran offered to reopen Hormuz within seven days, the opposite of what an end to the closure should produce. The Strait has been effectively closed since February 28, and oil spent September repricing the bypass routes around it, not the strait itself.
The first leg up ran from September 8 to 15. A Houthi strike on Saudi Aramco sites and the September 10 strike that shut the East-West pipeline took out the main route around Hormuz and widened the war from a chokepoint to a supply source. Brent peaked at US$108.75 on September 15. The leg down ran from that peak to September 22, when reports that President Trump was open to meeting Iranian President Pezeshkian at the UN General Assembly and preparations to restart the pipeline cut Brent 8.7% to US$99.25.
The offer of September 23 and 24 reversed the move, because it was conditional on eased US pressure and independent shipping trackers put restored traffic near 9% of normal against a US government claim above 50%. On September 28 Washington rejected the plan and demanded nuclear terms in the first round, and oil barely moved: WTI traded as high as US$96.53 and closed lower, as Saudi loadings from Yanbu resumed and Middle East crude exports reached a September high, per Kpler. Qatar is carrying an amended proposal. President Trump has said he expects a deal only after the November midterms, and the June memorandum that restored about 40% of normal flows lapsed.
Why it matters going forward. The oil price at the end of September reflects bypass capacity, not an expectation that Hormuz reopens. That makes it fragile to the one thing the market has not priced: a second failure of the Saudi route. A deal framework from the Qatar channel would lower oil further from a base already discounted, and a pipeline failure would send Brent through its September peak. Neither outcome is the base case, and the gap between the two is wider than the trading range of the month.
Section 03What the Patterns Imply
Five patterns, one structure. September was the month the usual transmission channels stopped working. Oil rose and the TSX fell. A central bank held and its yields rose. Gold met a war and fell. A Fed hike was followed by lower Canadian long yields the next day and higher ones over the following two weeks. In each case the variable that moved the price was the US duration premium, and the evidence for that came on the last day of the month, when a soft inflation print removed a priced Fed hike and left the 30-year yield higher.
The risk running into October is that Canadian assets are now priced for two things at once: a Bank of Canada that tightens into a weakening economy, and a US long end that keeps rising. Three events test both. US September payrolls arrive on October 2, Canadian September CPI on October 19, and both central banks decide on October 28, the Bank of Canada with a full Monetary Policy Report.
The US 10-year yield stays between 5.1% and 5.4% and oil trades in a US$95 to US$110 Brent range on alternating diplomacy and bypass headlines. The Canadian 5-year yield holds between 3.55% and 3.80%.
The Bank of Canada holds on October 28 with hawkish language, caught between 3% headline inflation and the weakest labour data of the year. The TSX trades 34,800 to 36,200 with resources and utilities lagging technology.
- US 10-year holds above 5.1%
- Brent holds US$95-110
- GoC 5Y stays in 3.55-3.80%
Soft US data and a lower Fed path pull the long end back below 5%, and the Qatar channel produces a framework that the market believes. Brent falls toward US$90 and the oil premium leaves the Canadian dollar alongside it.
Gold recovers above US$4,400 as real yields ease, and the TSX returns toward the 36,300 level of September 22.
- US 10-year closes below 5.0%
- Brent below US$95
- Gold above US$4,400
The 30-year yield rises through 5.75% and the 10-year toward 5.5%, while a second strike on the Saudi bypass sends Brent through its September peak of US$108.75. Both move together in a way September only half showed.
USD/CAD moves above 1.43, the Canadian 5-year yield breaks 3.85%, and the TSX closes below its September low of 35,236.
- US 30-year above 5.75%
- Brent above US$109
- USD/CAD above 1.43
The asymmetry going into October is that neither central bank needs to act for the market to reprice. The Federal Reserve raised once in September and the Bank of Canada did not move, yet the 10-year Treasury yield rose 56 basis points since August 28, the Canadian 5-year yield rose 36 and USD/CAD rose 2.3%. The decisions that matter most to a Canadian portfolio before October 28 are being made in the Treasury market, not by the committees.
Section 04Data Appendix
The daily closing series underlying every chart and figure in this report. September 7 was Labour Day and both the TSX and the US markets were closed, so the month contains twenty-one sessions. Brent and WTI are front-month futures closes, gold is the front-month COMEX futures close, and the yield column is the Bank of Canada Valet 5-year benchmark and CAD/USD is the inverse of the Bank daily average USD/CAD rate. The Aug 31 row is the base for every percentage change in this report. Blank cells indicate sessions where a clean figure was not independently captured.
| Session | TSX | WTI US$ | Brent US$ | Gold US$ | GoC 5Y % | CAD/USD |
|---|---|---|---|---|---|---|
| Aug 31 (base) | 36,180.72 | 85.76 | 90.49 | 4,481.50 | 3.33 | 0.7212 |
| Sep 1 | 35,825.73 | 90.22 | 94.65 | 4,396.40 | 3.35 | 0.7196 |
| Sep 2 | 36,091.61 | 90.76 | 95.63 | 4,414.60 | 3.42 | 0.7213 |
| Sep 3* | 36,633.12 | n/a | 95.52 | 4,539.90 | 3.41 | 0.7252 |
| Sep 4 | 36,513.80 | n/a | 96.28 | 4,476.60 | 3.40 | 0.7225 |
| Sep 8 | 36,123.10 | 93.03 | 97.92 | 4,439.00 | 3.44 | 0.7255 |
| Sep 9 | 35,906.56 | 96.05 | 101.21 | 4,460.70 | 3.48 | 0.7247 |
| Sep 10 | 35,506.30 | 102.48 | 107.63 | 4,407.30 | 3.63 | 0.7235 |
| Sep 11 | 35,697.50 | 100.05 | 104.61 | 4,408.90 | 3.65 | 0.7212 |
| Sep 14 | 35,702.50 | 97.14 | 105.68 | 4,351.90 | 3.65 | 0.7190 |
| Sep 15 | 35,582.07 | 100.75 | 108.75 | 4,332.80 | 3.65 | 0.7185 |
| Sep 16 | 35,491.30 | 102.43 | 105.83 | 4,387.50 | 3.64 | 0.7170 |
| Sep 17 | 35,874.26 | 101.91 | 104.82 | 4,399.70 | 3.54 | 0.7149 |
| Sep 18 | 35,806.65 | 96.08 | 103.87 | 4,424.90 | 3.59 | 0.7142 |
| Sep 21 | 36,009.40 | 92.37 | 100.34 | 4,383.90 | 3.57 | 0.7132 |
| Sep 22 | 36,335.61 | 90.52 | 99.25 | 4,376.40 | 3.54 | 0.7110 |
| Sep 23 | 35,751.43 | 92.16 | 103.08 | 4,318.40 | 3.69 | 0.7094 |
| Sep 24 | 35,706.46 | 94.61 | 106.60 | 4,298.00 | 3.69 | 0.7074 |
| Sep 25 | 35,800.89 | 92.41 | 104.32 | 4,321.20 | 3.65 | 0.7070 |
| Sep 28 | 35,489.86 | 92.60 | 105.28 | 4,168.40 | 3.68 | 0.7058 |
| Sep 29 | 35,460.30 | 89.38 | 102.59 | 4,179.70 | 3.69 | 0.7048 |
| Sep 30 | 35,235.90 | 90.42 | 103.53 | 4,235.40 | n/a | n/a |
*September 3 TSX close of 36,633.12 was the highest of the month, 0.9% below the August 25 record close of 36,957.63. WTI is not shown for September 3 and 4. No Bank of Canada benchmark yield or daily average exchange rate was published for September 30, when the Canadian bond market was closed for the National Day for Truth and Reconciliation. The TSX remained open. Sources differ slightly on some settlement prices; this table follows the series named above.