
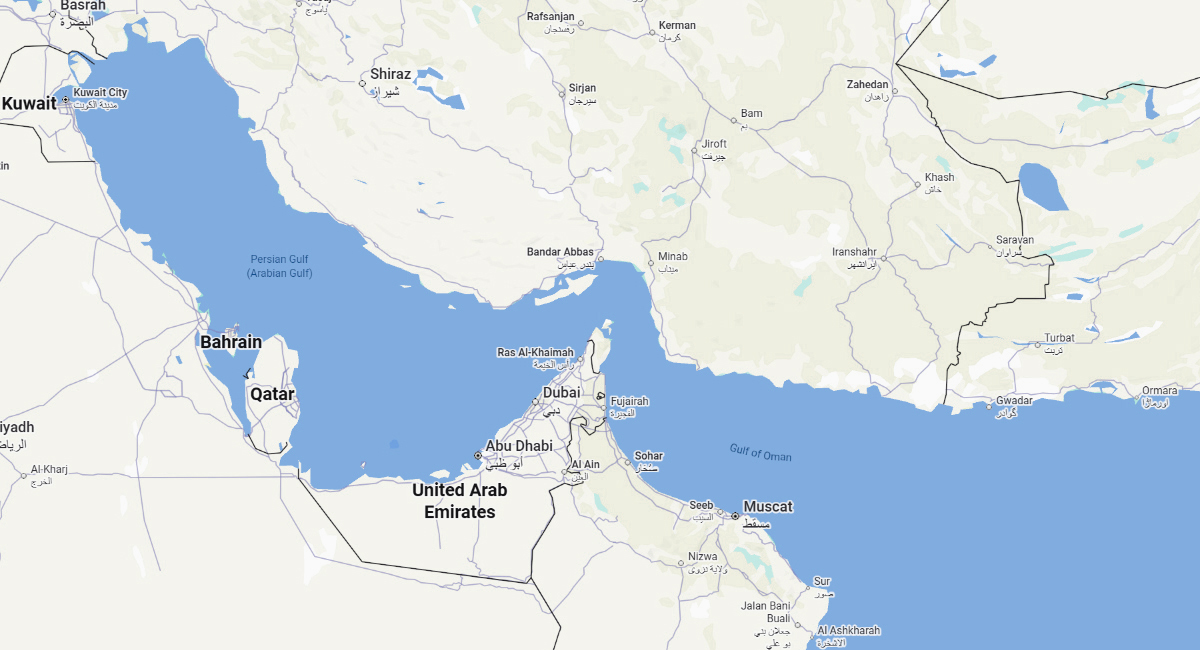
The oil market had spent three and a half months pricing a geopolitical floor into Brent crude. The floor was the Strait of Hormuz closure, which began February 28 when US and Israeli strikes on Iran cut off roughly 20% of the world's seaborne oil supply. At its peak in early April, Brent traded above $112. By Thursday, June 11, Trump was in the Oval Office telling reporters the US had "basically" settled the war. Brent was trading below $87. The floor is moving.
What Actually Happened Thursday
The sequence on June 11 was the most decisive diplomatic signal of the three-and-a-half-month conflict. Trump cancelled planned US strikes against Iran, told reporters a deal had been "largely negotiated," and said he expected documents to be signed "over the next few days," potentially in Europe. Iran's semi-official Fars news agency reported that Tehran was "likely to approve" a 14-point agreement. The draft, as reported by Iran's Mehr News Agency, includes Iran's commitment to reopen the Strait of Hormuz within 30 days, the lifting of US oil sanctions on Tehran, the release of frozen Iranian funds, and a withdrawal of US forces from the region. Trump confirmed on camera that the naval blockade would be lifted "as part of the deal" and that oil prices would "drop like a rock" once signed.
Two qualifications matter. First, Iran had not formally approved the draft by Friday morning. Tehran's approval process requires sign-off from Supreme Leader Khamenei, whose direct communications have been absent from the public record since early in the conflict. Second, Trump has announced imminent deals on at least three prior occasions since April, each followed by a resumption of military exchanges. The market is discounting Thursday's announcement at roughly 70% probability, which is why Brent fell to $86 rather than to the $75 the Bank of Canada's April MPR assumed for mid-2027.
The Chain from Hormuz to Canadian Portfolios
The Strait of Hormuz is a 33-kilometre-wide chokepoint at the mouth of the Persian Gulf. Under normal conditions, approximately 21 million barrels per day of crude and petroleum products pass through it, representing roughly one-fifth of global oil consumption. The February 28 closure did not eliminate those barrels from the global supply chain overnight: some was rerouted around the Cape of Good Hope, some was absorbed from strategic reserves, and some demand was simply deferred or destroyed. But the net effect was a sustained supply shock that pushed prices well above the pre-conflict range of $65 to $75 for Brent.
For Canadian oil sands producers, the Hormuz closure was a structural gift. Western Canadian Select, which trades at a discount to WTI, rose in tandem with global benchmarks. Canadian Natural Resources, Suncor, Imperial Oil, Cenovus, and Enbridge all saw their valuations re-rate upward on the combination of elevated realized prices and the expectation that the supply disruption would persist. The TSX energy sub-index outperformed the broad composite for the duration of the conflict.
A confirmed deal and Hormuz reopening removes that re-rating catalyst. The question is not whether Canadian energy stocks give back some of the war premium. The question is how much, on what timeline, and whether the underlying business at $85 WTI is still attractive at current valuations.
Brent crude surged from approximately $67 in late February to above $111 at the April 7 peak as the Strait of Hormuz closure tightened global supply. The June 11 deal signal pushed prices to their lowest level since early March. Fitch Ratings' full-year 2026 average forecast of $87 per barrel, contingent on a Hormuz reopening, is now essentially where the market is trading.
The Canadian Energy Sector Asymmetry
The asymmetry in how a deal affects the TSX is the critical planning variable. When ceasefire signals arrive, the broad TSX typically rallies as financial stocks and rate-sensitive sectors benefit from lower bond yields and reduced inflation risk. Energy stocks face the inverse pressure: the same development that lifts banks and utilities compresses the realized price assumptions built into oil sands valuations.
The April 8 first-ceasefire episode showed this dynamic cleanly. The TSX surged over 1.5% on the ceasefire announcement while Canadian Natural Resources, Suncor, and Imperial Oil each fell more than 6% as WTI dropped below $95. The current situation, with Brent near $86, reflects a much larger portion of the war premium already priced out. The remaining question is whether a Hormuz reopening, with a 30-day normalization timeline, pushes Brent toward the $75 range that the Bank of Canada assumed for mid-2027, or whether the market settles near Fitch's $87 full-year average as underlying demand absorption and non-OPEC production levels provide a floor.
For advisors with clients holding concentrated positions in TSX energy names, the relevant analytical frame is not the peace deal itself but the price at which the underlying business remains attractive. Suncor's cost of supply for oil sands operations sits in the $35 to $45 WTI range. At $83 WTI, the business is profitable. At $75, it is profitable but with less margin. The war premium is disappearing. The underlying business has not changed.
The Base Case and the Tail Risk
The base case as of Friday morning is that a signed agreement materializes within days, Hormuz begins the 30-day normalization process, and Brent settles in the $85 to $90 range as supply returns progressively and underlying demand provides a floor. Fitch Ratings, which has maintained the most detailed public analysis of the closure's market impact, forecasts Brent averaging $87 for the full year 2026. That forecast is already essentially where the market is trading, suggesting much of the deal premium is reflected in current prices.
The tail risk is a repeat of the April pattern: a deal announcement, a brief ceasefire, and then a resumption of military exchanges as the detailed terms prove impossible to finalize. On that scenario, Brent recovers toward $95 and Canadian energy stocks regain the ground they have lost this week. The Polymarket prediction market, which has tracked this conflict since February, had the probability of a permanent peace deal by year-end at approximately 60% as of June 12. A 40% tail probability of continued conflict is not trivial. Advisors should not position client portfolios as though the deal is done.