
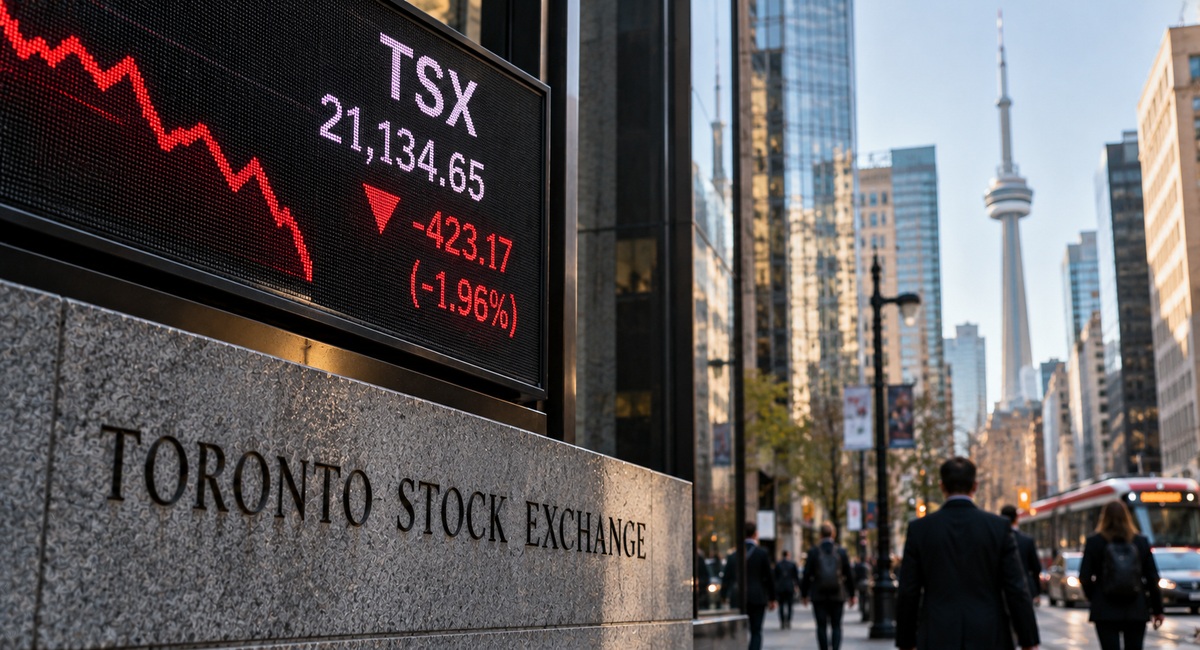
The S&P/TSX Composite closed at 35,584.46 on October 14, down 1.9% from its August 31 close of 36,270.50, but the index hides a 20.6 percentage point gap underneath. The iShares energy ETF (XEG) is up 7.5% over that period and the iShares gold miners ETF (XGD) is down 13.1%. The two sectors are reacting to the same oil shock in opposite directions, and the rate path is the channel that separates them.
The Rate Channel Splits the Index
Oil near US$106 lifts energy earnings directly. It also lifts inflation, and inflation has pushed the Federal Reserve to raise its target range to 3.75% to 4.00% on September 16. The U.S. 10-year Treasury yield closed at 5.19% on October 14, up 43 basis points from 4.76% on August 31. Gold pays no yield, so a higher yield raises the cost of holding it. Gold fell from US$4,481.50 to US$4,107.90 over the period, a decline of 8.3%.
Gold miners fell 13.1% against that 8.3% decline in the metal, about 1.6 times as far, because costs are fixed in the short run and a lower gold price comes straight out of margins. XGD closed at $52.83 on October 14, its lowest close of the period and 14.9% below its September 3 close of $62.06.
XGD has fallen 13.1% while XEG has risen 7.5% since August 31, and the gap is the rate channel at work in a single index.
XEG is the iShares S&P/TSX Capped Energy ETF, XGD the iShares S&P/TSX Global Gold ETF and XFN the iShares S&P/TSX Capped Financials ETF. Each series is rebased to 100 at its August 31 close, shown by the dashed line, and sessions without a close in all four series are excluded.
October 14 Was a Rate Day
The most recent session shows the split at full strength. U.S. consumer prices released on October 14 came in hotter than expected, with headline inflation at 3.7% and the core monthly gain at 0.3% against 0.2% expected, and the S&P/TSX Composite fell 1.1%, or about 400 points, to 35,584.46. The S&P 500 fell 1.1% to 7,718.94 and the VIX rose to 16.87 from 15.27.
Inside the Canadian index the damage was concentrated. XGD fell 4.2% and gold fell 1.7%. XFN fell 0.5%. XEG closed unchanged at $30.55 as the oil price held near its highs, with Brent closing at US$106.06. The gold miners moved about 2.5 times as far as the metal, which fell 1.7%. The 10-year yield closed at 5.19%, 3 basis points below the prior day, so the split reflects a repricing of the Fed path and not a move in the long end alone. A day when the index fell 1.1% therefore contained a 4.2% decline in one sector and no decline in another. Anyone reading only the index saw a broad sell-off. The sector tape shows a sell-off in the assets most sensitive to the U.S. yield.
What Decides the Next Leg
Financials have gone nowhere, which matters for what the index tells you. XFN is down 1.7% since August 31, in line with the 1.9% fall in the TSX, so the move is not a banking story. It is the net of a 7.5% gain in energy and a 13.1% loss in gold.
Two dates will test the spread. Statistics Canada reports September CPI on October 19, and Continuum Economics expects headline inflation to hold at 3.0%. The Fed and the Bank of Canada both decide on October 28. The odds of a Fed increase were roughly 42% to 50% on October 14 depending on the source, while LSEG put the odds of a Bank of Canada increase at about 25% after the September jobs loss of roughly 68,000.
The implication is that the spread is the position. A hot print and a hike would extend the pattern, with energy holding and gold miners under pressure. A soft print would relieve the rate channel first, which would help gold miners before it did anything for energy. A reopening of the Strait of Hormuz would hit the energy leg directly.