
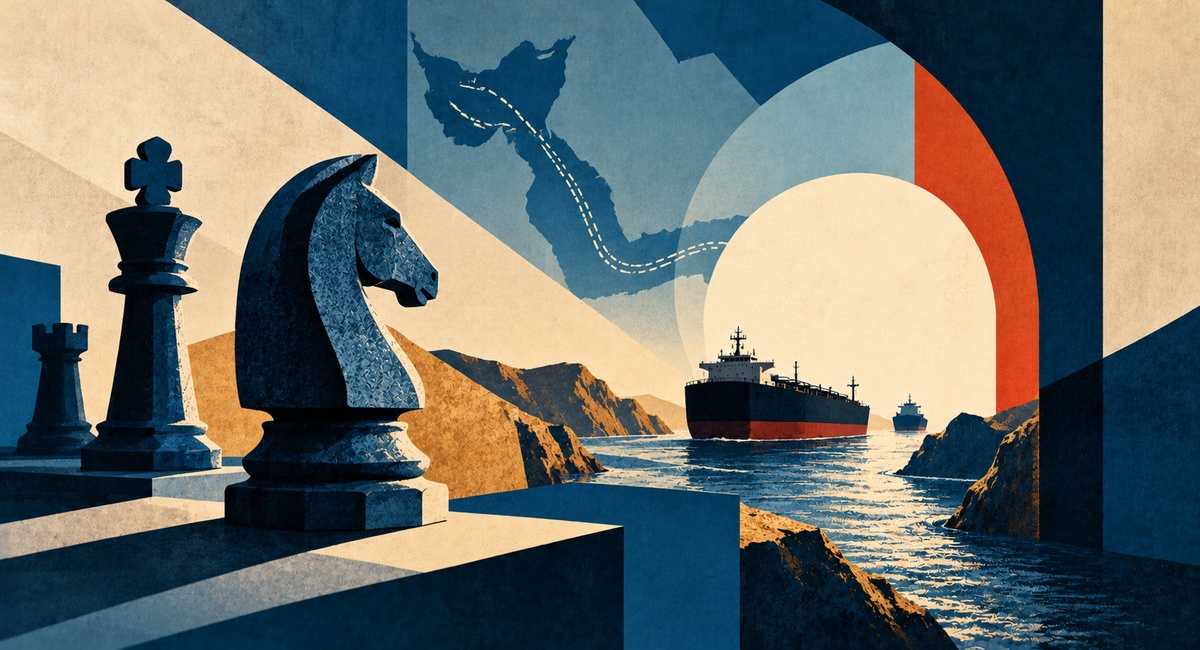
Oil flows through the Strait of Hormuz fell to about half of pre-conflict levels over the past week, UBS Evidence Lab data show, and Henri Patricot of UBS said attacks on tankers continue to be reported at the highest intensity since the start of the conflict. Front-month WTI crude settled at $97.97 on Thursday, below the $102.43 it closed at on September 16.
For Canadian portfolios the chain has three links: the crude price, the Canadian energy equities that sell at it, and the headline inflation the Bank of Canada must weigh on October 28. UKMTO recorded 15 attacks from October 6 to 14, 11 of them in the last four days, according to Al Jazeera, and Kpler counted ten tankers struck from September 28 to October 4.
WTI has traded between $88.28 and $102.43 over the past 22 sessions and finished above $97 on Thursday, even as Hormuz flows fell from about 75% to about 50% of pre-conflict levels.
Kpler counted ten tankers struck in the strait from September 28 to October 4. The October 11 barrel count is the daily transit figure reported by Al Jazeera and fell on a Sunday, when no WTI settlement occurs.
How Hormuz Reaches the Canadian Energy Sector
Before the war began on February 28, the strait handled about 125 large commercial vessels a day and about 17.1 million barrels a day, roughly 20% of global crude and LNG supplies, according to Al Jazeera. Daily transit has since swung widely: nearly 20.8 million barrels on October 8, then 2.9 million on October 11, the lowest of the month.
Official claims point in opposite directions. US Secretary of State Marco Rubio said last week that almost as much oil is flowing out as before the conflict, while Mohammadreza Naqdi, an adviser to the IRGC commander, said the strait is closed and under full Iranian control. The UBS data sit between them, and CENTCOM said US forces and partners helped Gulf producers ship more than 19 million barrels of crude on Monday through a US Navy-led shuttle system.
WTI sets the price for the Canadian energy sector, yet the equities did not follow it on Thursday. WTI settled up 3.03%, while the TSX Capped Energy Index fell 0.5% to 475.85, lagging the composite gain of 1.55% by about two points.
Why the Front Month Is Not the Signal
WTI fell from $102.43 on September 16 to $88.28 on October 7, including through the week of the Kpler-counted tanker strikes, when it closed between $89.38 and $92.87. It has since risen 7.1% from $91.49 on October 8 to $97.97, as measured barrels through the strait dropped.
Brent closed at $105.69 on Tuesday against $95.09 for WTI, a gap of $10.60, which suggests that more of the disruption premium sits in the seaborne benchmark than in the US one.
The market has responded to flow, not to the count of attacks. Dimitrios Laloudakis, a UBS macro quantitative strategist, said the front contract is remaining tepid while longer-dated futures are repricing higher, a pattern that treats the disruption as lasting rather than as a one-week event.
That distinction matters for Canadian producers, whose valuations rest on what oil is expected to sell for over years, not on the price this week. A rising back end of the curve supports the earnings outlook, and Thursday equity move shows that it is not automatic.
The Base Case and the Tails
The base case is more of the same: attacks continue, the US blockade of Iranian southern ports and the US Navy shuttle persist, and flows swing between 50% and 75% of pre-conflict levels, which keeps WTI inside the range of the past month. Bypass routes offer limited relief: UBS reports that crude loadings through Yanbu and Fujairah averaged 3.3 million barrels a day in October so far, down from 5.4 million in September.
The upside tail is escalation. Israeli media reported that Prime Minister Benjamin Netanyahu urged President Donald Trump to restart strikes on Iran before the November midterm elections, and Netanyahu denied the reports, according to Oilprice.com. Iran warned it would respond pre-emptively to any perceived threat of renewed strikes.
The downside tail is a deal or new supply. Iran says the United States accepted some of its seven conditions for reopening the strait, calling the response insufficient, and ING analysts described a Saudi plan to expand East-West pipeline capacity as bearish news, noting 1.2 million barrels a day could be added within months.
What It Does to the Bank of Canada and the Dollar
Higher energy prices feed headline inflation, which was 3.0% in August against CPI-trim of 1.9%, according to Bank of Canada data. Royce Mendes of Desjardins said higher energy prices could force the Bank to tighten soon, and LSEG pricing reported by Reuters puts October hike odds near 25%.
The Canadian dollar has not benefited. It traded at 70.05 US cents on October 9, its weakest level since April 2025, with crude near $94 at the time. A Federal Reserve policy range of 3.75% to 4.00% against the Bank of Canada rate of 2.25% has outweighed the oil link so far. September CPI arrives on Monday, October 19, and the Federal Open Market Committee meets October 27 and 28, the same day the Bank decides.
The result is a split. Energy exposure helps offset the fuel cost that households pay, while the same oil move pushes inflation and hike odds higher, which raises variable-rate mortgage payments.