
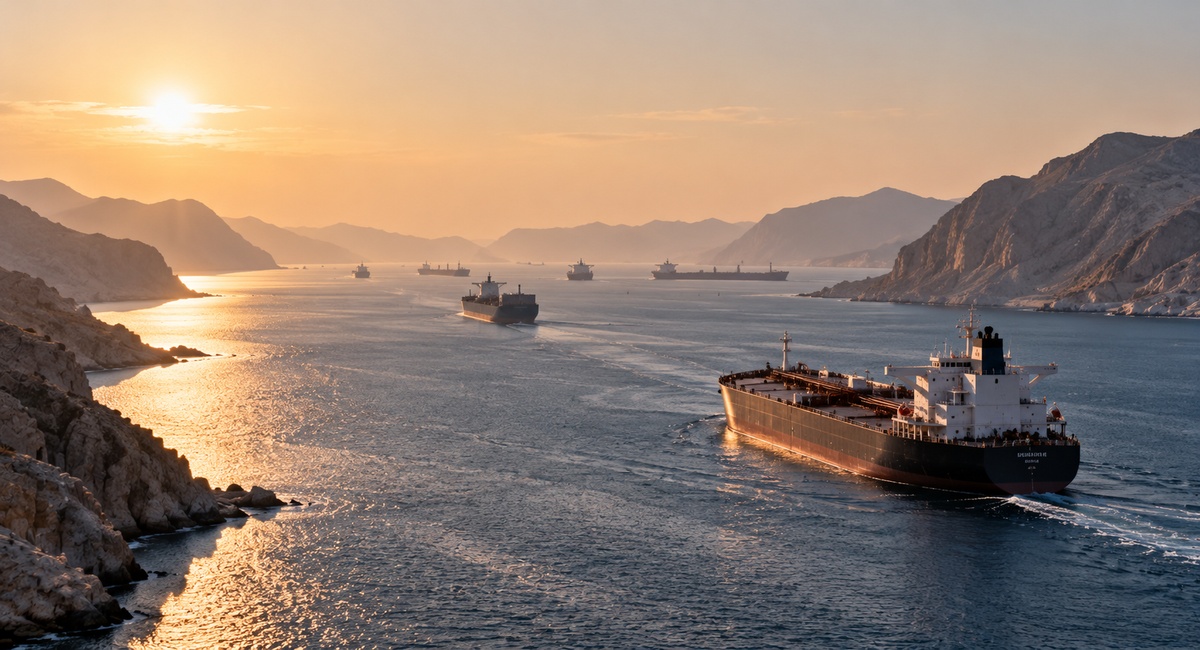
Four commercial vessels passed through the Strait of Hormuz on Oct. 18, against a typical day of 85, according to the IMF PortWatch count. Brent crude traded above US$110 a barrel this week, from about US$72 before the war that began in February. For a Canadian portfolio the question is not who controls the strait. It is which of three channels carries the damage or the gain: energy earnings, consumer inflation, or the Bank of Canada.
How Hormuz Reaches a Canadian Portfolio
The strait carried about 20% of seaborne oil before the war. The traffic count shows how little of that flow is moving.
Four commercial vessels transited on Oct. 18, about 5% of the typical daily count of 85. The typical-day figure is the pre-crisis baseline reported by IMF PortWatch.
The first channel is producer earnings. Canada is a net oil exporter, and a Brent price near US$113, reported on Oct. 22, lifts cash flow at producers whose output is priced off the global benchmark. WTI for December delivery traded near US$97.92 on Oct. 21, which is the North American price most relevant to Canadian crude.
The second channel is the consumer. Gasoline was up 27.8% from a year earlier in the September CPI, drawn from Statistics Canada figures. The third is the policy rate. Headline CPI of 3.1% and a hike probability near 78% in swaps pricing put the Bank of Canada decision on Oct. 28 inside this story. The same oil price raises producer earnings and household costs at once.
Base Case, Escalation and Reopening
The base case is persistence: a closed strait, a Brent price near the levels of this week, and a market that treats each incident as noise until supply changes. The incidents are not small. Iran claimed that seven ships were hit, and U.S. President Donald Trump accused Tehran of faking the hits. On Oct. 21 the Iranian Revolutionary Guards said a supertanker had struck a mine south of the strait. That claim was reported as unconfirmed.
The two tails are far apart. Citi said in April that it saw US$150 oil if the disruption persisted. BofA said in June that a full reopening could pull the 2026 Brent average down to US$82. Oil slid in August on hopes of a reopening, which then faded. Reopening and escalation are both possible, and neither is the expected outcome.
Gold sits on the other side of the same trade. December gold traded at US$4,145.20 on Oct. 21, and the Canadian dollar at about 71.08 U.S. cents. A portfolio with energy exposure and no hedge against a reopening carries one risk. A portfolio with no energy exposure carries the other, through higher fuel costs and a policy rate that moves.
The Planning Conversation
Clients concentrated in energy have a position that rises with the closure and falls on a reopening. The advisor conversation is about sizing that exposure against the tail, not about forecasting the strait. Clients on fixed incomes face the reverse, because fuel costs and the Oct. 28 decision both press on their budgets. The practical step is to test each household against both tails before the decision, using the US$82 and US$150 scenarios as bookends and not as forecasts.