
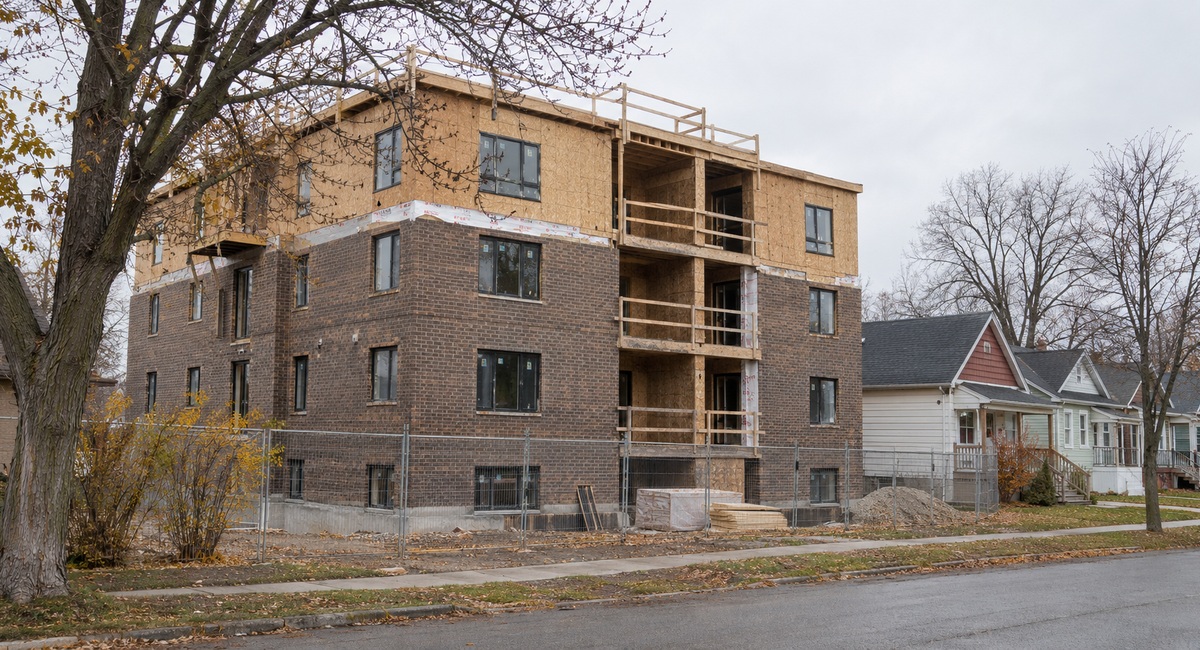
Canadian municipalities issued $12.88 billion in building permits in September, down 4.1% from August, Statistics Canada reported Thursday. Most of the $552.8 million decline came from multi-unit housing. The value of single-family permits moved in the opposite direction, rising $53.6 million. For Canadian advisers, the difference matters because a household with a deposit on a new apartment, a contractor expecting work and an investor holding a national real-estate fund each depend on different projects moving ahead.
Two Provinces Drove the Multi-Unit Decline
Multi-unit permit values fell $529.3 million to about $5.1 billion. British Columbia accounted for $292.1 million of the drop and Alberta for another $186.8 million. Together they accounted for about 90% of the net national decline in that category. Meanwhile, Ontario's single-family permit values rose $103.3 million, more than the national gain in that category, as activity elsewhere offset part of Ontario's increase.
The provincial totals show why the details matter. Ontario recorded a 6.6% increase in total permit value, while Alberta fell 15.3% and British Columbia fell 10.3%. In British Columbia, residential permits fell 23.9% while non-residential permits rose 13.8%. A contractor focused on apartments and a supplier serving commercial sites could therefore face very different order books in the same province.
Monthly values are seasonally adjusted and in current Canadian dollars. September 2026 is preliminary. The dashed line marks September 2025 for the year-over-year comparison.
The Quarterly Unit Count Adds a Different Measure
The August-to-September decline followed a rebound in August. September permit values were still 5.7% above the same month a year earlier in current dollars and 1.9% higher after adjusting for construction prices. The comparison with August captures the latest direction. The annual comparison shows the month remained above its year-earlier level even after the price adjustment.
Across the third quarter, municipalities authorized 71,300 dwellings, down from 78,500 a year earlier. Statistics Canada reported that residential construction intentions were virtually unchanged from the second quarter in constant dollars. The two figures answer different questions and use different comparison periods. The first counts authorized dwellings year over year. The second measures the inflation-adjusted value of residential permits quarter over quarter. Project size, building type and location can move dollar values independently of the number of homes.
Which Cash Flows Depend on a Project Moving Ahead?
For a household committed to a pre-construction purchase, the financial planning inputs are the deposit schedule, the expected closing date and the cash and borrowing capacity available at closing. If the closing shifts, the household may have to carry rent or another mortgage for longer. That possibility can be tested against the household's own dates, with the purchase agreement and financing terms checked separately.
For a construction-business owner, the near-term question is which expected jobs have signed contracts, confirmed start dates and payment milestones that match payroll and supplier obligations. A regional permits release can prompt that conversation. The owner's project list and receivables determine how much of the expected work can support near-term spending.
Investors can apply the same distinction to real-estate holdings. A portfolio earning rent from occupied properties depends on different cash flows from one funding developments ahead of occupancy. Thursday's release shows where planned construction changed. Starts, completions and project disclosures will show how much of that pipeline advances.